Every warehouse AMR pitch ends with a productivity multiple: two to three times the units per hour, sometimes more. Almost none of them ends with a ratio — how many robots per picker that multiple required. The ratio is where the economics actually live, because you pay per robot and you save per person.
So let me calculate it. The question is: at what robots-per-worker ratio does an AMR fleet stop paying for itself on labor alone?
The one deployment with both numbers
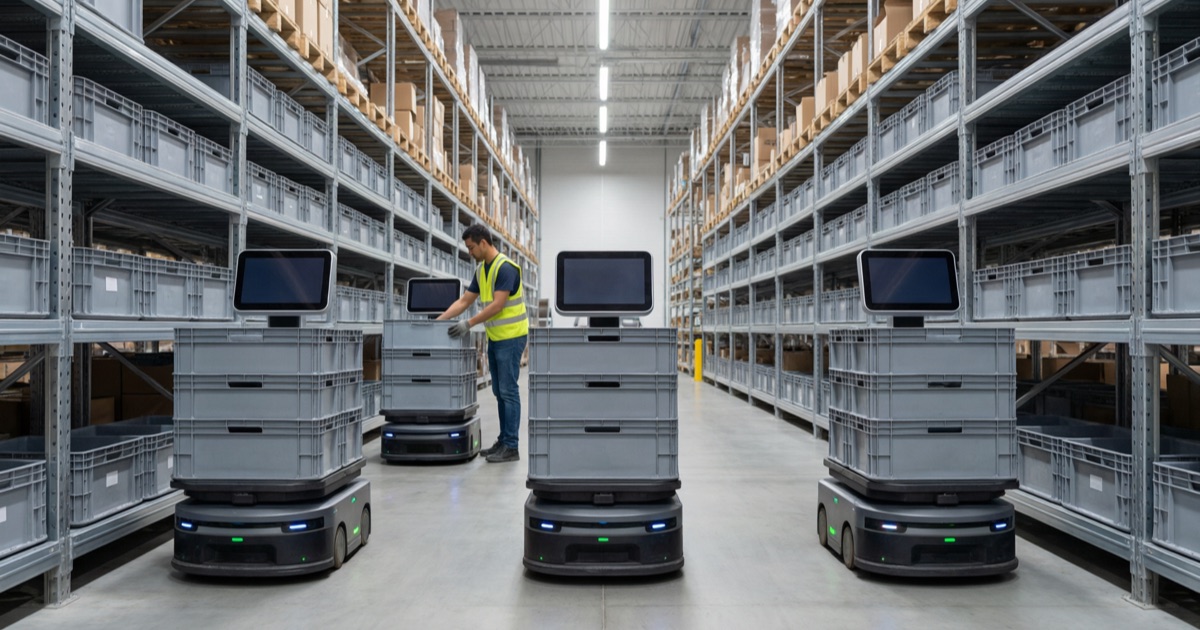
Vendor case studies rarely publish robot count and headcount together. One does. In the Fleet Feet case study published by Locus Robotics, a 75,000 sq ft greenfield distribution center went live with 22 LocusBots, and the result is stated plainly:
> "With 22 LocusBots and five pickers, they're now picking 180 units an hour, compared to previously 85 units an hour with a team of 20 to 25 pickers."
That gives us everything: a ratio of 4.4 bots per picker, and per-picker throughput going from 85 to 180 units per hour. The case study's own headline figure — a 111 percent increase in UPH — confirms the 85-to-180 numbers are per picker, not facility totals.
Two other published deployments land in the same productivity band. Boulanger's Hénin-Beaumont facility went from 120 units per hour to more than 250 within six weeks, per DC Velocity. Locus's own materials describe a consistent 2x to 3x UPH improvement across its base, with more than three million picks per day.
The model
The arithmetic is deliberately simple, and every input is stated so you can re-run it with your own.
Take a facility that needs a fixed throughput. At 85 UPH per picker it needs T/85 pickers; at 180 UPH it needs T/180. The labor saved is the difference. The fleet cost is the robots-per-picker ratio times the assisted headcount, times whatever a robot costs per month.
Set those equal and the throughput term cancels out entirely. What remains:
Breakeven cost per robot per month = (annual fully loaded picker cost × (1/85 − 1/180) × 180) ÷ (12 × ratio)
For fully loaded labor I used a $20/hour base plus 35 percent for benefits and payroll burden — $27.00/hour, or $56,160 a year at 2,080 hours. Base wage sources vary: PayScale reports $17.22/hour, ZipRecruiter $17.35, Indeed $22.04. I could not pull the BLS Occupational Employment Statistics figure for Stockers and Order Fillers directly — bls.gov blocks automated retrieval — so this is aggregator data, and I ran the model at all three wage points.
| Robots per picker | Breakeven $/robot/month at $17.22 base | at $20.00 base | at $22.04 base |
|---|---|---|---|
| 0.5 | $9,007 | $10,461 | $11,528 |
| 1.0 | $4,504 | $5,231 | $5,764 |
| 2.0 | $2,252 | $2,615 | $2,882 |
| 3.0 | $1,501 | $1,744 | $1,921 |
| 4.4 (Fleet Feet) | $1,024 | $1,189 | $1,310 |
What the table says
The ratio matters more than the wage. Moving from $17.22 to $22.04 an hour — a 28 percent swing in labor cost — changes the breakeven by 28 percent. Moving from one bot per picker to four moves it by 340 percent. Fleet density is the dominant variable, and it is the one buyers control.
Dense fleets are hard to justify on labor alone. At Fleet Feet's 4.4 bots per picker, the labor saved supports roughly $1,024 to $1,310 per robot per month. Every credible secondary estimate of warehouse RaaS pricing sits above that: commonly cited ranges run $2,000 to $8,000 per robot per month.
I have to flag those RaaS figures hard. No AMR vendor publishes per-robot pricing. A widely repeated claim of "$2,000/month plus $35,000 setup" for Locus is attributed to an investor overview — I read that document, and it states the RaaS model and that the monthly fee includes software, support and optimization, but it contains no per-robot price at all. The number does not survive contact with its own source. Treat the $2,000–$8,000 band as unverified secondary estimate, not vendor pricing.
So run it backwards instead. Given a quoted monthly rate, the model tells you the maximum density that clears on labor:
| Quoted rate per robot/month | Breakeven ratio (at $20/hr base) |
|---|---|
| $1,500 | 3.49 bots per picker |
| $2,000 | 2.62 |
| $2,500 | 2.09 |
| $3,000 | 1.74 |
| $4,000 | 1.31 |
At $2,500 a month, anything above roughly two bots per picker is not being paid for by headcount reduction.
Then why did Fleet Feet buy 22?
Because labor substitution was not the whole case, and the case study says so. The same deployment reports a 98 percent increase in order fulfillment rate, replenishment to 85 stores going from once a week to five times a week, and new-picker training falling from about a week to 30–45 minutes.
None of that is headcount. It is service level, inventory turns, and the ability to staff a peak with temporary workers who are productive in under an hour. A dense fleet buys throughput and flexibility; a sparse fleet buys labor savings. They are different purchases, and the second one is much easier to defend in a spreadsheet.
Our read: if your business case rests entirely on removing pickers, the honest ceiling is somewhere near one to two robots per picker at commonly quoted rates. Above that, you are buying service level, and you should say so in the business case rather than inflating the labor line until it fits.
What this model deliberately excludes
Integration and WMS work, which is where a large share of automation budgets actually goes — our analysis of why warehouse automation ROI projections miss puts the integration tax at 20 to 40 percent. Multi-shift operation, which improves robot economics substantially. Facility redesign. And the assumption that displaced labor is genuinely removed rather than redeployed — in most real deployments, including this one, headcount moves rather than vanishes.
The productivity figures are also vendor-published and selected for publication. A 111 percent gain in a purpose-built greenfield facility is not a median outcome, and readers should discount accordingly.
This piece also updates an earlier, more generic comparison we published in April, warehouse robot vs manual labor, which modeled per-unit costs without accounting for fleet density. Density turns out to be the variable that decides it. For the vendor-economics side of the same market, see our Geek+ numbers breakdown and the warehouse robot category.
Sources
- Locus Robotics — Fleet Feet and Körber case study (PDF): 22 LocusBots, five pickers, 85 → 180 UPH, 98% fulfillment increase
- Locus Robotics — human and robot warehouse collaboration
- DC Velocity — Boulanger: 120 to more than 250 units per hour in six weeks
- Stack Capital Group — Locus investment overview (RaaS model described; no per-robot pricing stated)
- PayScale — picker hourly rate
- Indeed — order picker salary
- ZipRecruiter — warehouse order picker hourly pay